
Developing effective strategies for increasing reader engagement shouldn’t feel like guesswork. If you don’t know who your most avid readers are, the impact of your engagement efforts, or understand how your community is growing over time, that ends today.
To help you answer your most challenging audience questions, we’re introducing Audience Analytics for Disqus. Whether you’re an editor or audience development manager, we want to help clear the mystery behind different engagement hurdles so you can find answers quickly and be in the driver’s seat towards strengthening the relationship with your readers.
Audience insights at your fingertips
We launched Content Analytics to help you understand which stories and topics are generating the most engagement. Now with Audience Analytics, you have insights about those readers’ engagement and the actions you can take to optimize it. Available to all Pro and Business customers, the dashboard is the newest addition to your audience development toolkit.

Let's take a look inside.
A snapshot of engaged readers
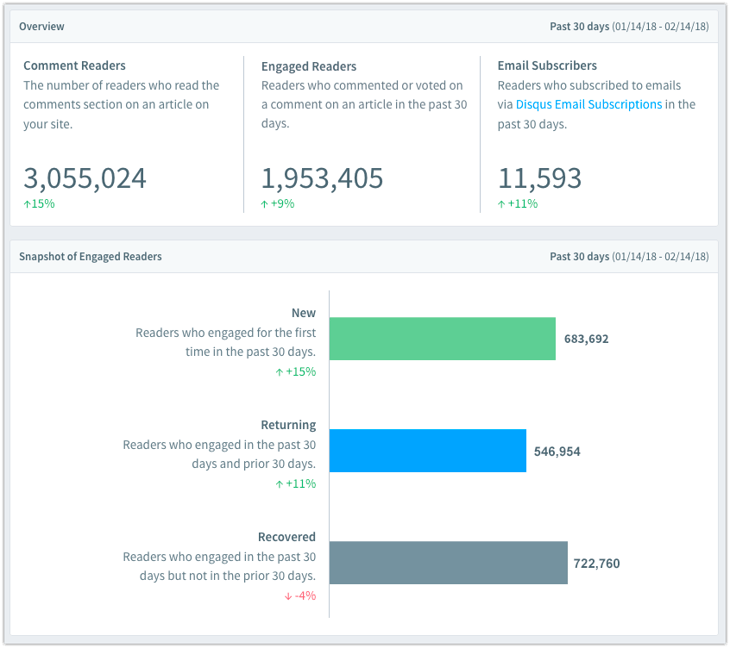
Getting readers to engage on your site requires a proactive approach. To do this, start by understanding how engaged your audience is currently. You can now find out how many users are reading the comments, engaging on the site (posted a comment or voted), and subscribing to your email list in the last 30 days. This gives you visibility into how your community is growing and the impact of your current engagement strategy.
Finally, drill down further for a breakdown of total New, Returning, and Recovered users to see how each segment is represented in your community and their respective rate of growth. This helps you prioritize your audience development efforts in the area with the highest potential for growth. For example, if you’re mostly acquiring new users who aren’t converting into regulars, mention these users in new discussions to encourage them to comment more and foster a habit of commenting.
Track community growth, month by month
To understand where your community is headed in the future, you need to know where it has been. You can now travel back in time to identify emerging trends about your community and the success of your efforts to acquire and retain readers. The is particularly useful for measuring the impact of changes you’ve made (e.g. website redesign, launch of subscription memberships, updated moderation settings) on your overall engaged audience.
While the Snapshot of Engaged Readers chart shows you a current breakdown of engaged users for the past 30 days, the Engaged Readers Over Time graph lets you compare snapshots from different days or months. For example, if you hover over January 30, 2018, you will see the historical Snapshot of Engaged Readers who engaged between January 1, 2018 and January 30, 2018.
Find your most engaged readers
Discover the people who make up the heartbeat of your site’s engagement in the Community Members section. Here you have a detailed profile of each user including their total engagements (comments + votes), the date of their first and most recent engagements, and their engagement status (new, returning, recovered, inactive).
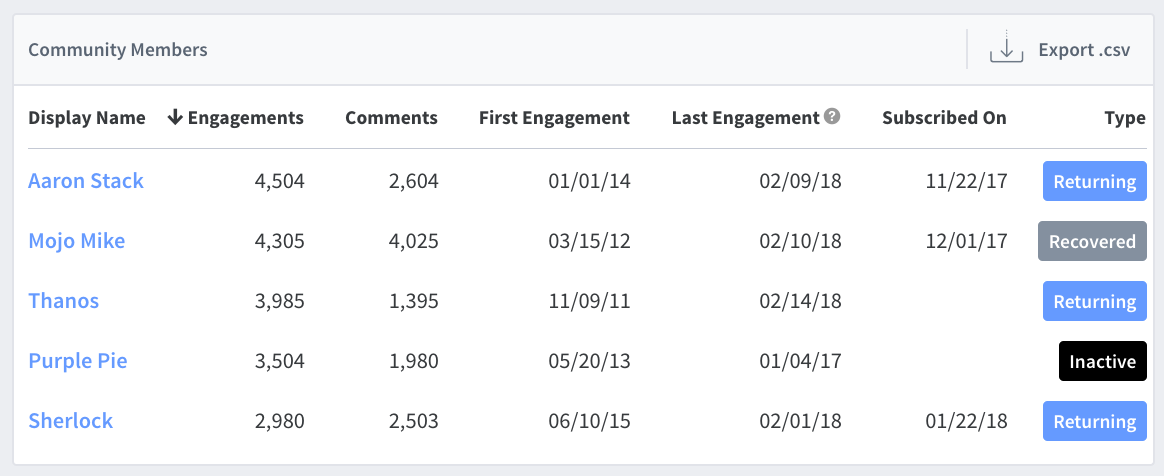
Additionally, you can sort by any of these columns to identify segments of users such as recently acquired users and the most active commenters. If you’d like to perform a deeper analysis, export the data as a CSV and combine with other reporting.
Get started with Audience Analytics
If you’re on a Pro or Business plan, you can get started now with Audience Analytics by heading over to your Disqus Analytics.
Let us know what you think! We welcome your feedback and would love to hear what insights you’d like Disqus to provide in the future about your audience.