.gif)
Let's face it—as extraordinarily busy people, we don't always have enough time to respond to everything we see on the internet. Sometimes we only have enough time to react.
That's why we built our Reactions feature a few years ago, to help publishers engage readers who may be too busy to jump into the comments section. Audiences LOVE Reactions—since we launched the feature in 2018, readers have Reacted to publisher content literally trillions of times across the Disqus network.
Many of our publishers have asked for a way to view their Reactions data. You asked, we listened.
Introducing Reactions Analytics, our new data dashboard designed to help you visualize and learn from how your audiences are reacting to your content.
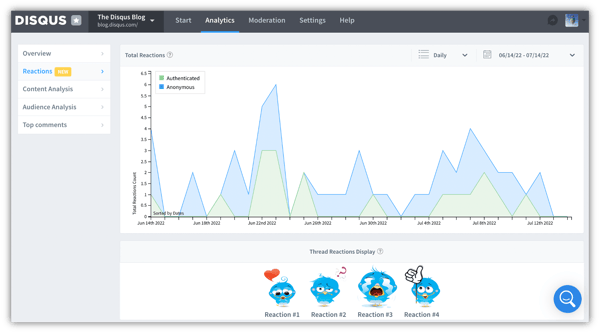
How your audience is reacting to your content, visualized
With Reaction Analytics, you remove the guesswork involved in determining if your content is resonating with your audiences. Have you started implementing a new content strategy and want to see if it's a hit? Interested in seeing your Reactions trends over time? You can do both of these things—and so much more—with Reactions Analytics.
Bring your anonymous readers into the fold
When we initially designed our Reactions tool, we made sure that everybody—not just logged-in Disqus users—would be able to React to publishers' content. We designed Reactions Analytics accordingly, breaking out the data to display your Authenticated (logged-in) users as well as your Anonymous users. After all, publishers need to know how their anonymous readers are reacting to their content if they want to convert them into loyal, logged-in users!
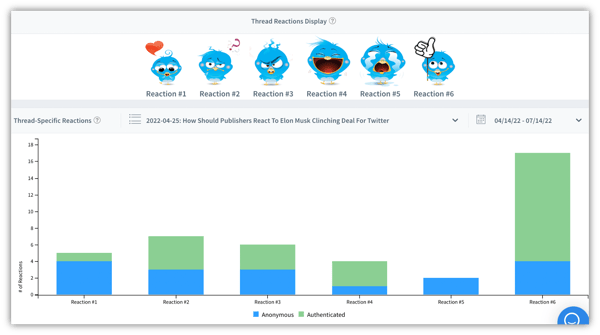
Thread-specific data that helps you drill down
In addition to displaying Reactions trends over time, Reactions Analytics allows you to drill deeper into article-specific data. You can zoom into specific articles to get a closer look at how individual pieces of content are resonating with your readers. Thread-specific data gives you insight into which categories of content yield the most engagement from your audience, enabling you to hone your content strategy accordingly and double down on producing similarly themed content.
Turn on Reactions if you haven't already!
Who has access to Reactions Analytics data? Well, everybody—or at least everybody who has the Reactions feature turned on! Don't have Reactions turned on? Just follow the directions here to set them up and you'll start seeing the data almost immediately.
Starting today, publishers who have Reactions enabled now have access to the last year's worth of retroactive data. To start checking out your Reactions Analytics data, simply head to the Analytics hub in your admin profile and you'll see the Reactions on the left-hand menu.
Questions, comments... Reactions?
This is just the first step in our efforts to build out a more comprehensive offering of analytics designed to help publishers optimize their engagement strategies. Sound off in the comments and let us know how we can improve from here, or simply leave us a Reaction!